

Bitcoin at a Turning Point: Will the Previous Drop Repeat and What the Market Shows Now
Bitcoin has once again entered a phase that creates a sense of familiar price behavior. Time for Action analyzed what is currently happening with the price and how justified concerns about a possible decline really are.
The current dynamics appear restrained after the previous drop, the price is moving within a narrow range with a slight upward slope. This type of movement is often interpreted as a recovery within a broader downward trend. It is not a full reversal, but rather a gradual rebound without a clearly defined impulse. A similar configuration has been observed before. At that time, the market also showed relatively stable movement within a channel after declining from higher levels. It appeared to be a recovery, but the price later lost support and dropped sharply from around $90,000 to approximately $60,000. This historical parallel is now drawing attention from analysts. At the same time, the current situation is not an exact copy of the previous one. The similarity of charts alone does not mean the same outcome will follow, it only indicates similar market conditions. In this case, technical analysis captures the shape of price movement but does not guarantee future scenarios.
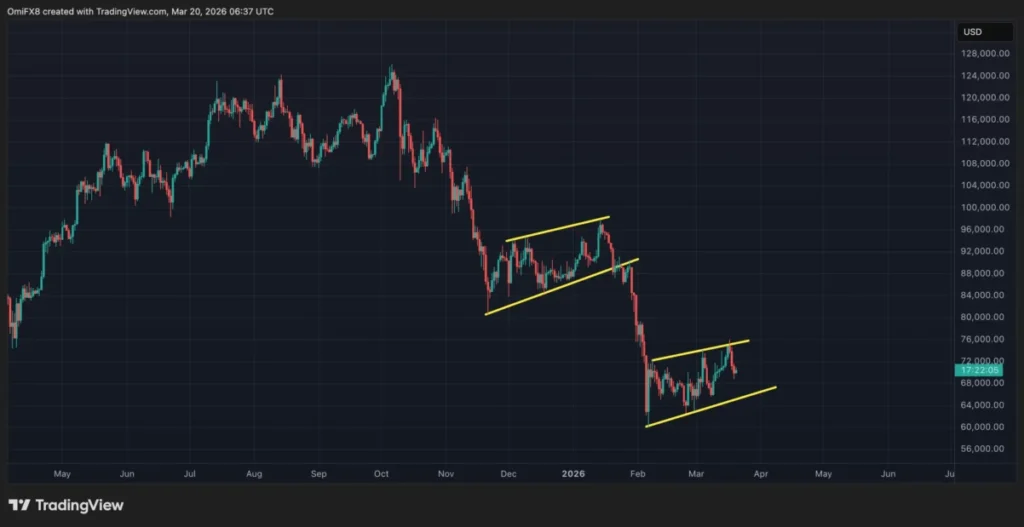
What is happening now can be described as a period of caution among market participants. Demand is present, but it does not generate strong upward momentum. Instead, there is slow upward movement that remains within a defined channel. This behavior often suggests that some participants are buying dips, but without enough conviction to establish a strong trend. An important reference point in this situation remains the lower boundary of the current range. A break below it may indicate increasing pressure from sellers and a continuation of the decline. This level is roughly around $65,800, which is currently viewed as local support.
At the same time, this level should not be treated as a critical threshold after which a large-scale drop becomes inevitable. It is rather a signal of a possible shift in short-term dynamics, not a guaranteed scenario. The opposite possibility is equally important. If the price manages to move above the upper boundary of the channel, it may indicate a gradual return of buying interest and a weakening of the downward movement. In that case, the market could gain grounds for more confident growth. This type of pattern in technical analysis is usually seen as a phase of directional decision-making. The market does not show a clear dominance of either side and moves within a limited range where each next step depends on participant reactions.


The key factor in this situation is not the resemblance to a previous period, but how the price behaves at the boundaries of the channel. These levels will determine whether the current phase develops into a continuation of the downward trend or becomes a base for new growth. At this stage, the market remains in a state of balance. Signs of buyer weakness are present, but they are not strong enough for definitive conclusions. Likewise, downside risks exist, but they are not absolute. Bitcoin is currently not on the edge of a predetermined scenario, but in a phase where its next direction is being decided. This uncertainty is what makes the current stage one of the most important for short-term market dynamics.
About the Author
Related posts:
 Bitcoin Without Panic: Why the Crypto Market Is Not Mirroring the Behavior of Stocks and Oil During War
  Crypto Market Liquidations: How the US-China Trade War Sparked Record Losses for Bitcoin
  Bitcoin Amid the Death of Iran’s Leader How a Geopolitical Shock Shook the Crypto Market
  Crypto Outflow from Iran Surges 700% After Airstrikes What It Means for Bitcoin